InsightGrid
Self-Serve Analytics With One Set of Metric Definitions, Visible SQL and Data Freshness
A concept study: we worked up this product, its architecture and its screens as an example of how we would approach it. The screens use fictional demo data and are design concepts, not screenshots of a live product, and this is not a client project.
About the Project
InsightGrid is a design concept for a self-serve analytics platform for a mid-size company with a small data team. Today two dashboards often show two numbers for the same word, such as revenue, and managers message the data team to find out which one is right. InsightGrid puts each metric in one shared definition, kept as code, with a named owner and an approved or draft status.
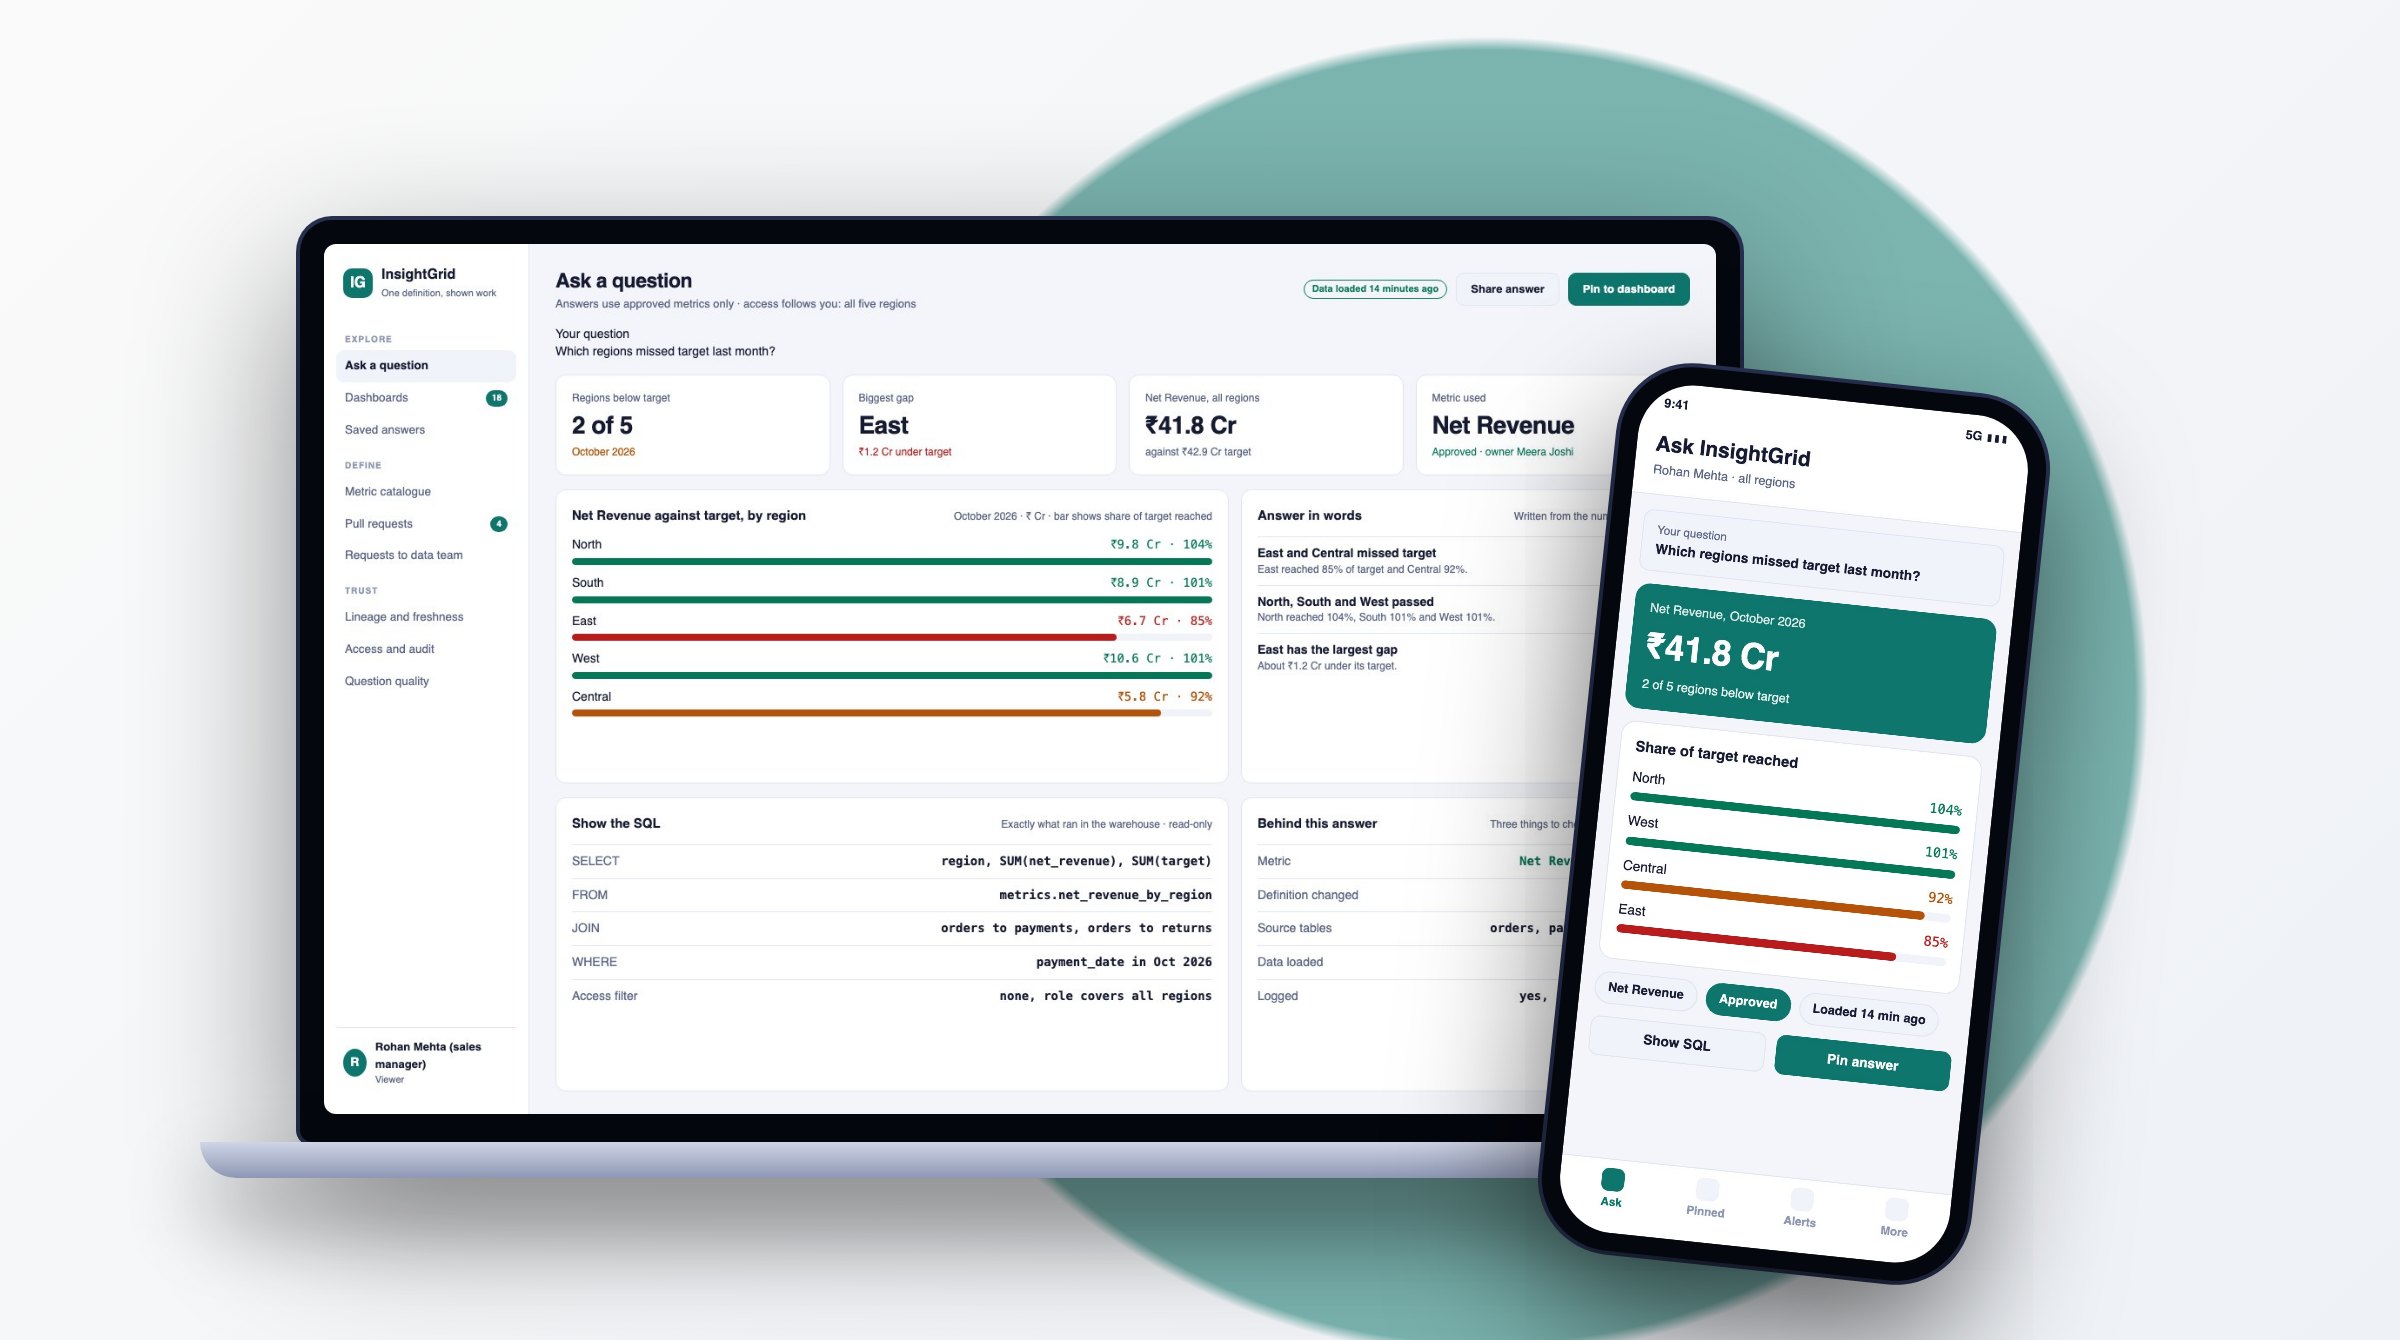
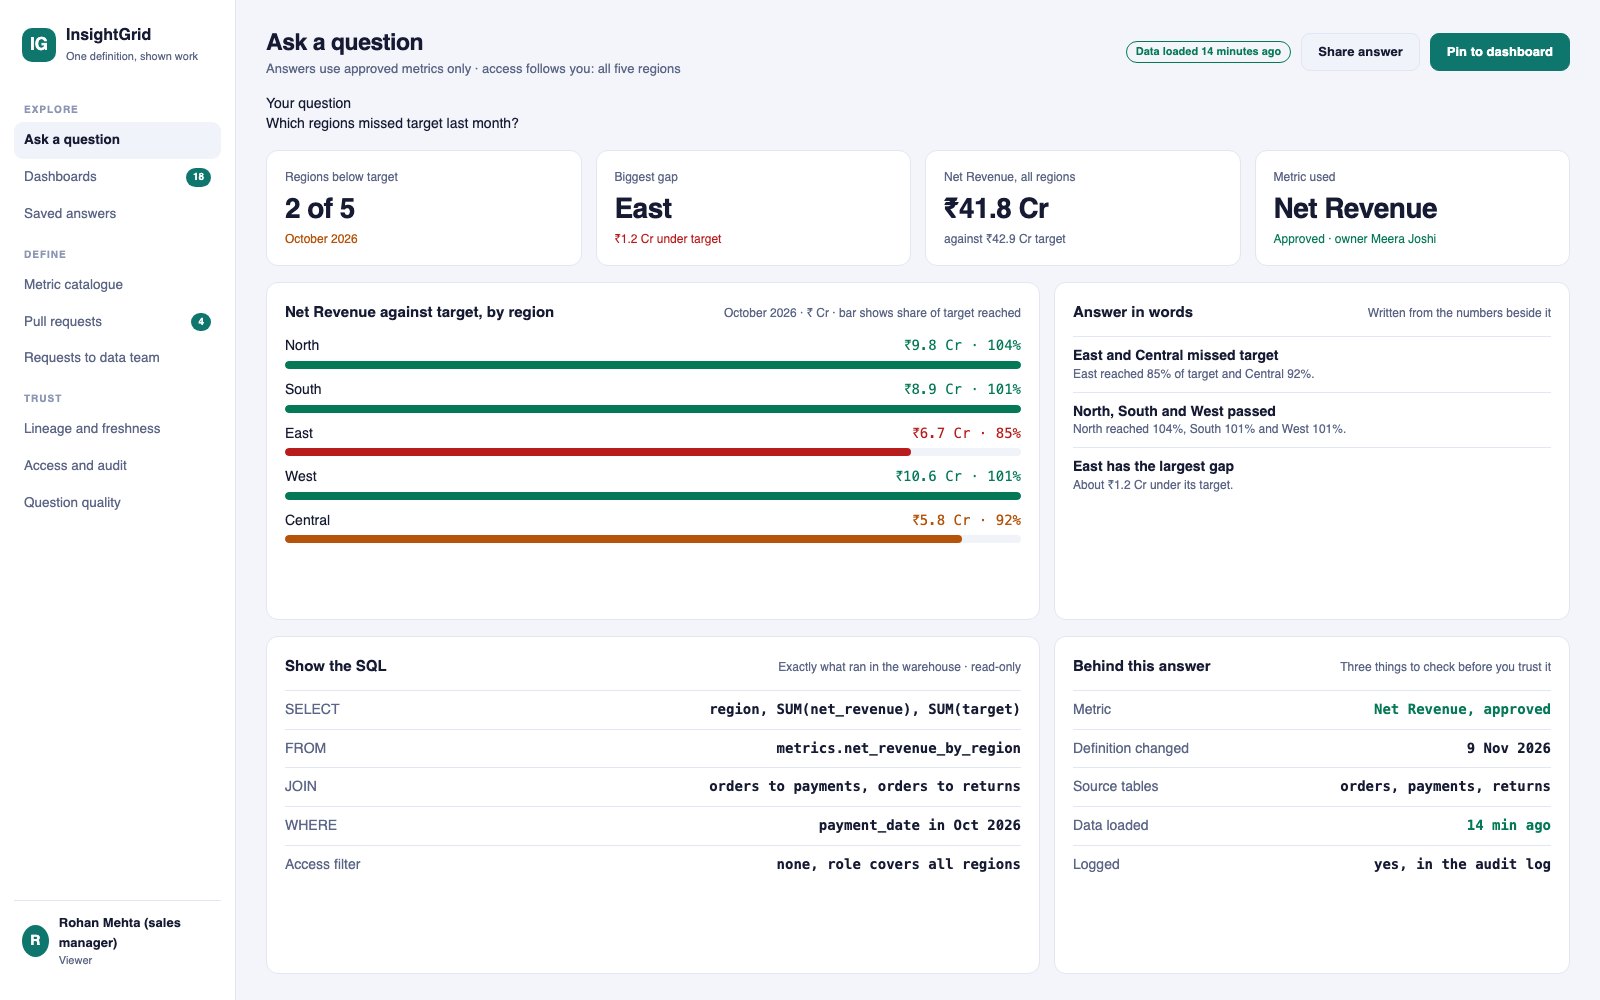
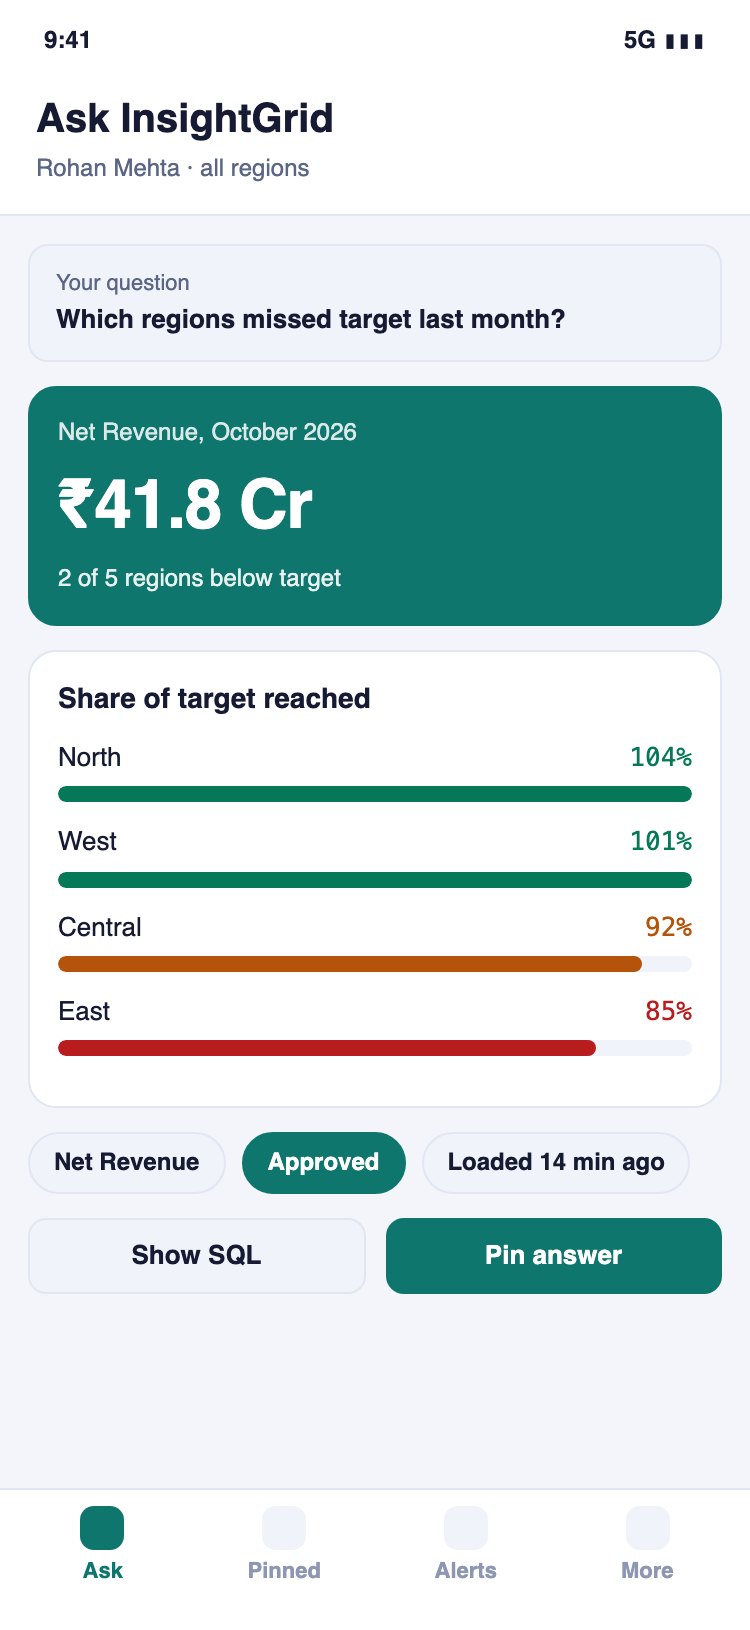
Dashboards, an API and a plain-English question box all read those same definitions. A manager can type which regions missed target last month and get a chart, a short written answer and the SQL (the query language of the warehouse) that produced it. The language model only picks approved metrics and calls a query tool. When a question falls outside the defined metrics, the product says so and offers to send it to the data team.
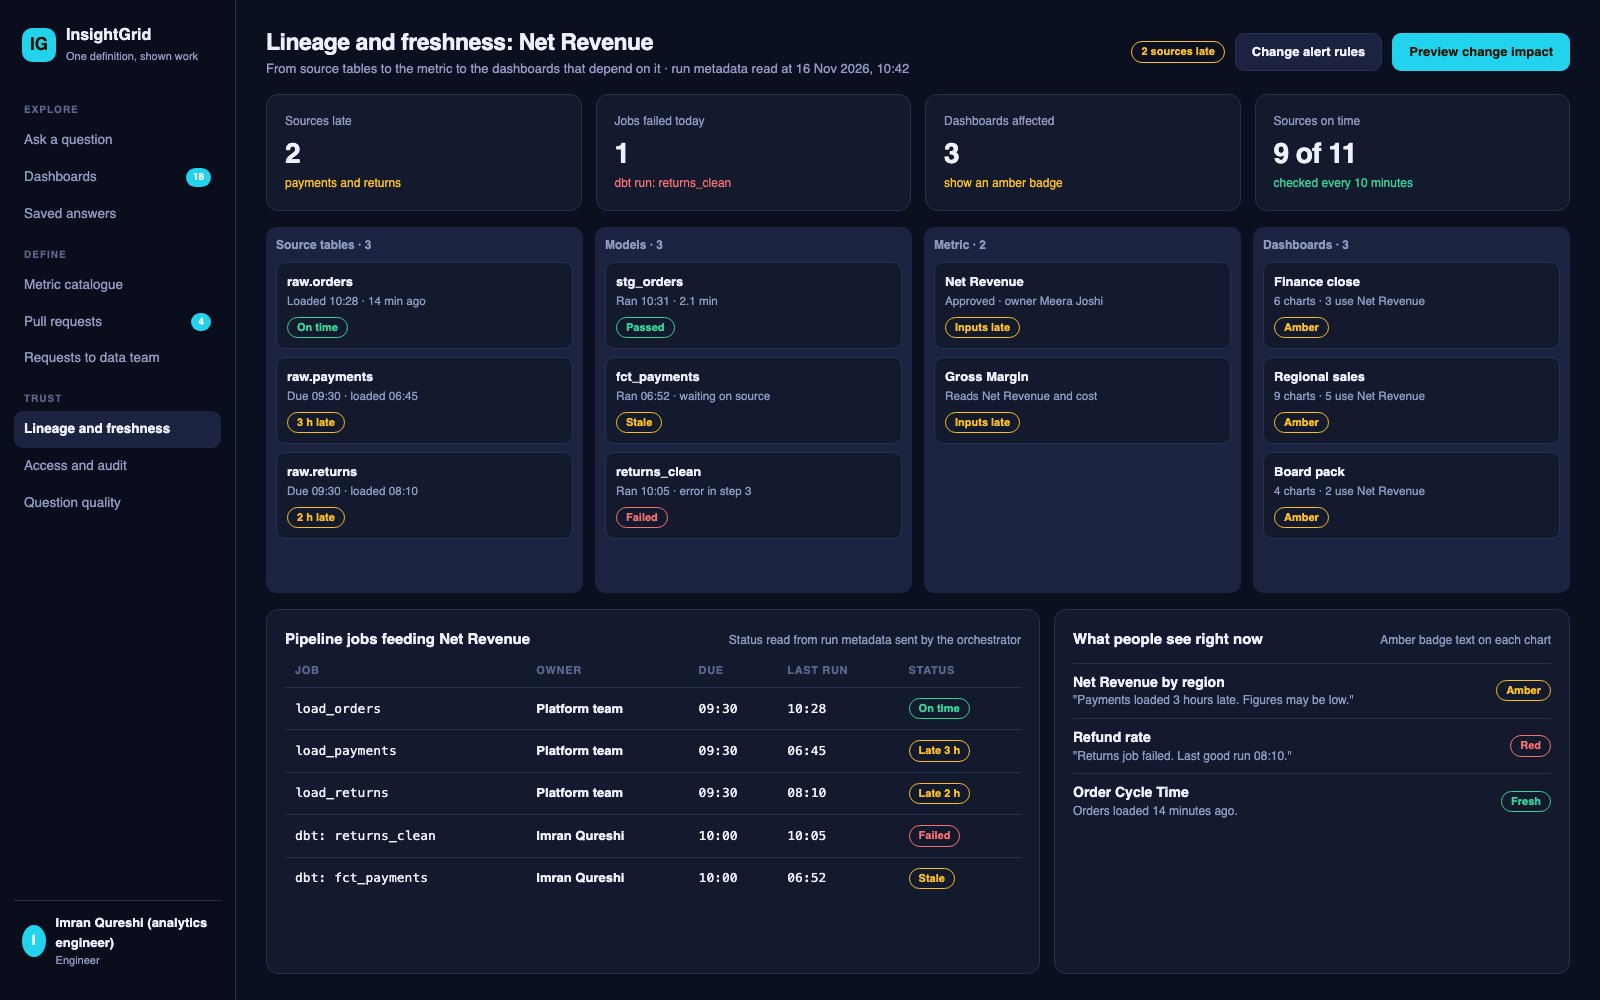
Every chart also shows when its source tables last loaded and turns amber when a load is late. A lineage view traces a metric back to its source tables and forward to the dashboards that depend on it. Access follows the person asking, so a regional manager sees only their own rows and masked columns stay masked in chat answers too. All names, tables and figures on the screens are fictional demo data.
Why This Matters Now
Market, rule and technology context for this kind of product, checked on 16 November 2026. Each item names its source.
- Metabase published guidance saying AI answers are only as reliable as the curated metrics and glossary beneath them, and that its AI assistant and MCP server see only what the asking person may see.Metabase (vendor blog), 19 Oct 2026
- OpenLineage 1.53.0 shipped with explicit lineage facets in the spec and fixes across Spark, SQL and Python integrations, showing the lineage standard is still moving fast.OpenLineage release notes, 1 Sep 2026
- Fivetran and dbt Labs completed their merger, and trade press TechTarget reported the combined company is pitching semantic modeling and open standards as data infrastructure for AI agents.TechTarget (trade press), 1 Jun 2026
- dbt Labs reran a text-to-SQL benchmark and reported that a modeled semantic layer errors on out-of-scope questions, while raw text-to-SQL can return plausible but wrong numbers. The authors sell the product and tested one dataset.dbt Labs (vendor blog), 7 Apr 2026
- Trade site IT Brief reported that Denodo joined the Snowflake-led Open Semantic Interchange, an open-source effort to share metric definitions between business intelligence (BI) and AI tools, still in development.IT Brief (trade press), 24 Mar 2026
Requirements & Objectives
- Keep each metric as one definition in version-controlled files, with a named owner, a plain description and an approved or draft status.
- Let a steward review a definition change as a pull request, see which dashboards it would alter, and publish it with a changelog entry.
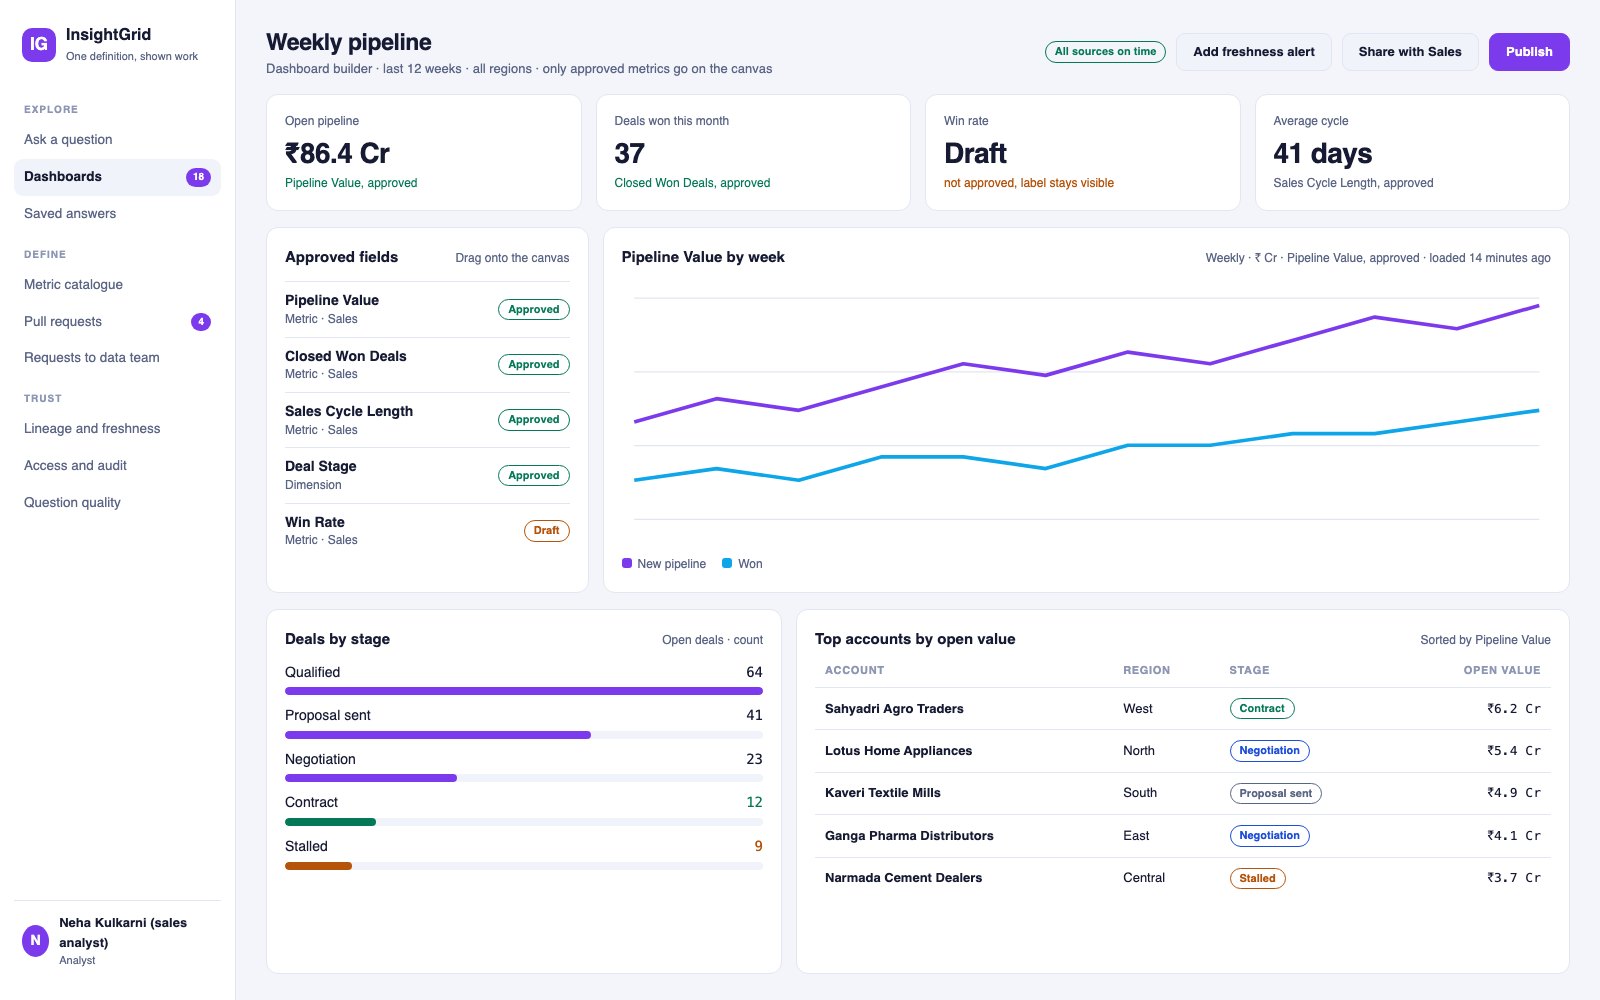
- Let business users build dashboards from approved metrics and dimensions without writing SQL, with draft metrics clearly labelled.
- Turn a plain-English question into a query on defined metrics only, show the chart and the SQL, and refuse out-of-scope questions with a request to the data team.
- Show on every chart when its source tables last loaded, and turn the badge amber or red when a load is late or a job fails.
- Show lineage from source tables and pipeline jobs to a metric and the dashboards that use it.
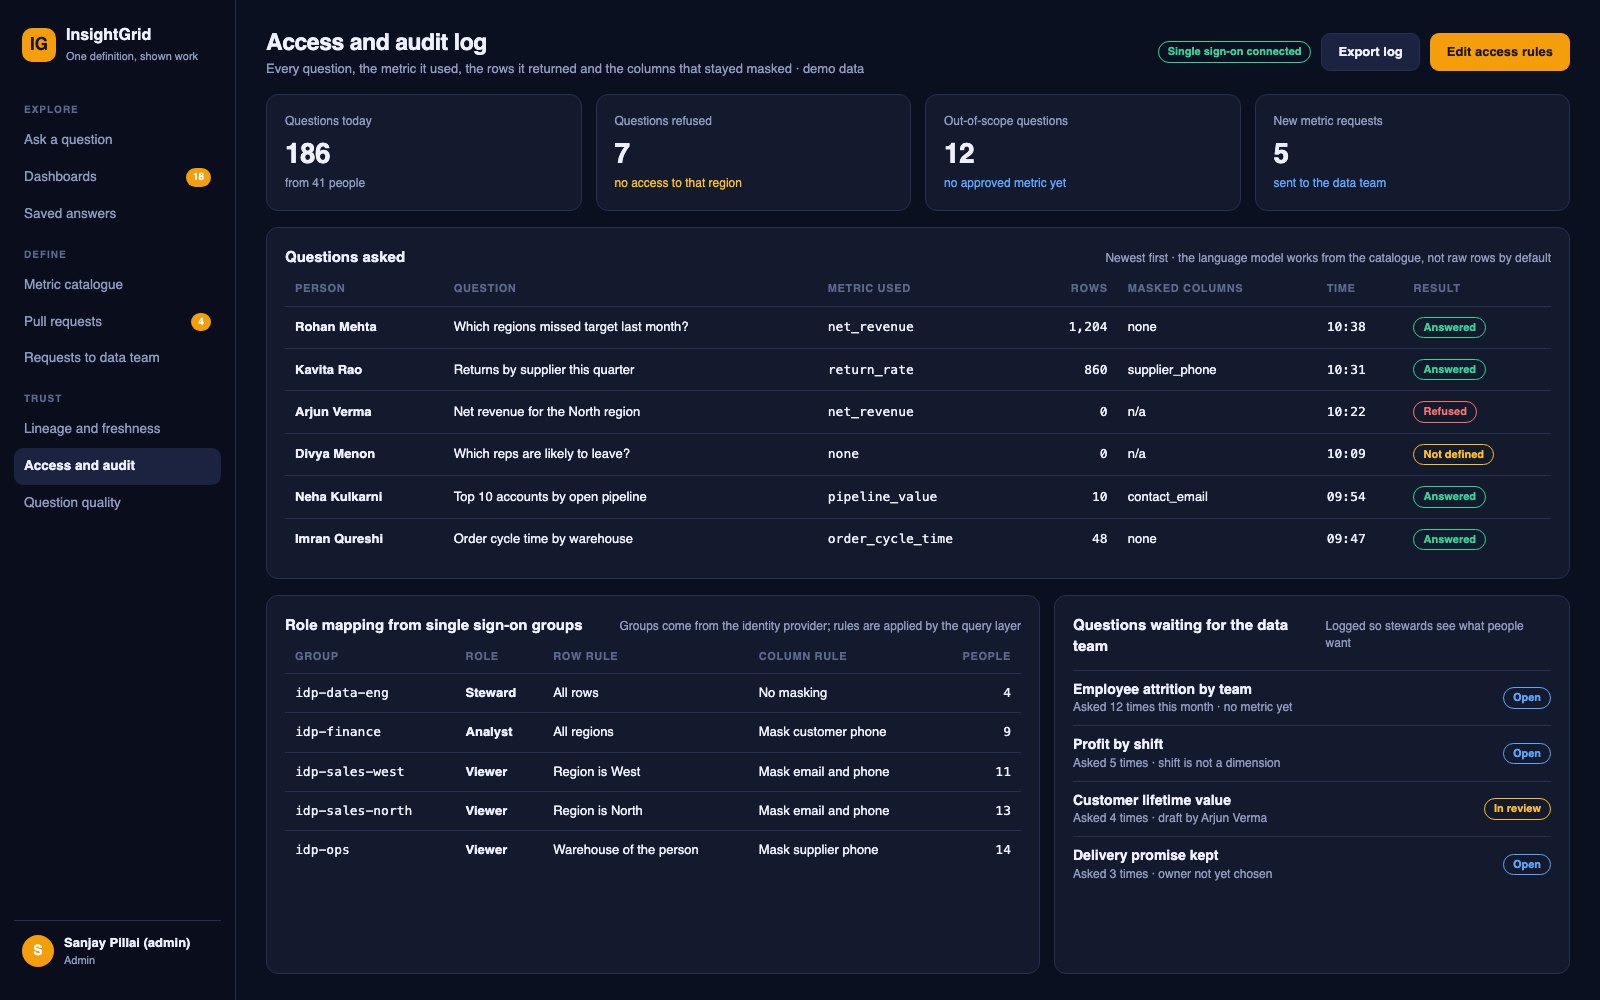
- Apply row and column access rules by the identity of the person asking, including in chat answers and in cached results.
- Log every question with the person, the metric used, the rows returned and the columns masked, and let an admin review the log.
The Engineered Solution
1One definition for every client
Metrics live as code in Git. Dashboards, the API and the question box all read the same compiled definitions, so revenue means one thing everywhere and a change is reviewed before it goes live.
2Questions answered from defined metrics
The language model sees the catalogue and must call a run-metric-query tool. It does not write free SQL over raw tables, and it says so when no approved metric covers the question.
3Work shown beside every number
A side panel lists the SQL, the joins, the filters and the metric definition. A badge shows how fresh the source tables are, so a reader can judge the figure before using it.
4Access that follows the person
Row and column rules come from the asker's sign-on group. The access scope is part of every cache key, so one person's cached answer is never served to someone with different access.
Design Concept Screens
Design concepts with fictional demo data. They show how the product could look and work, not a live release.
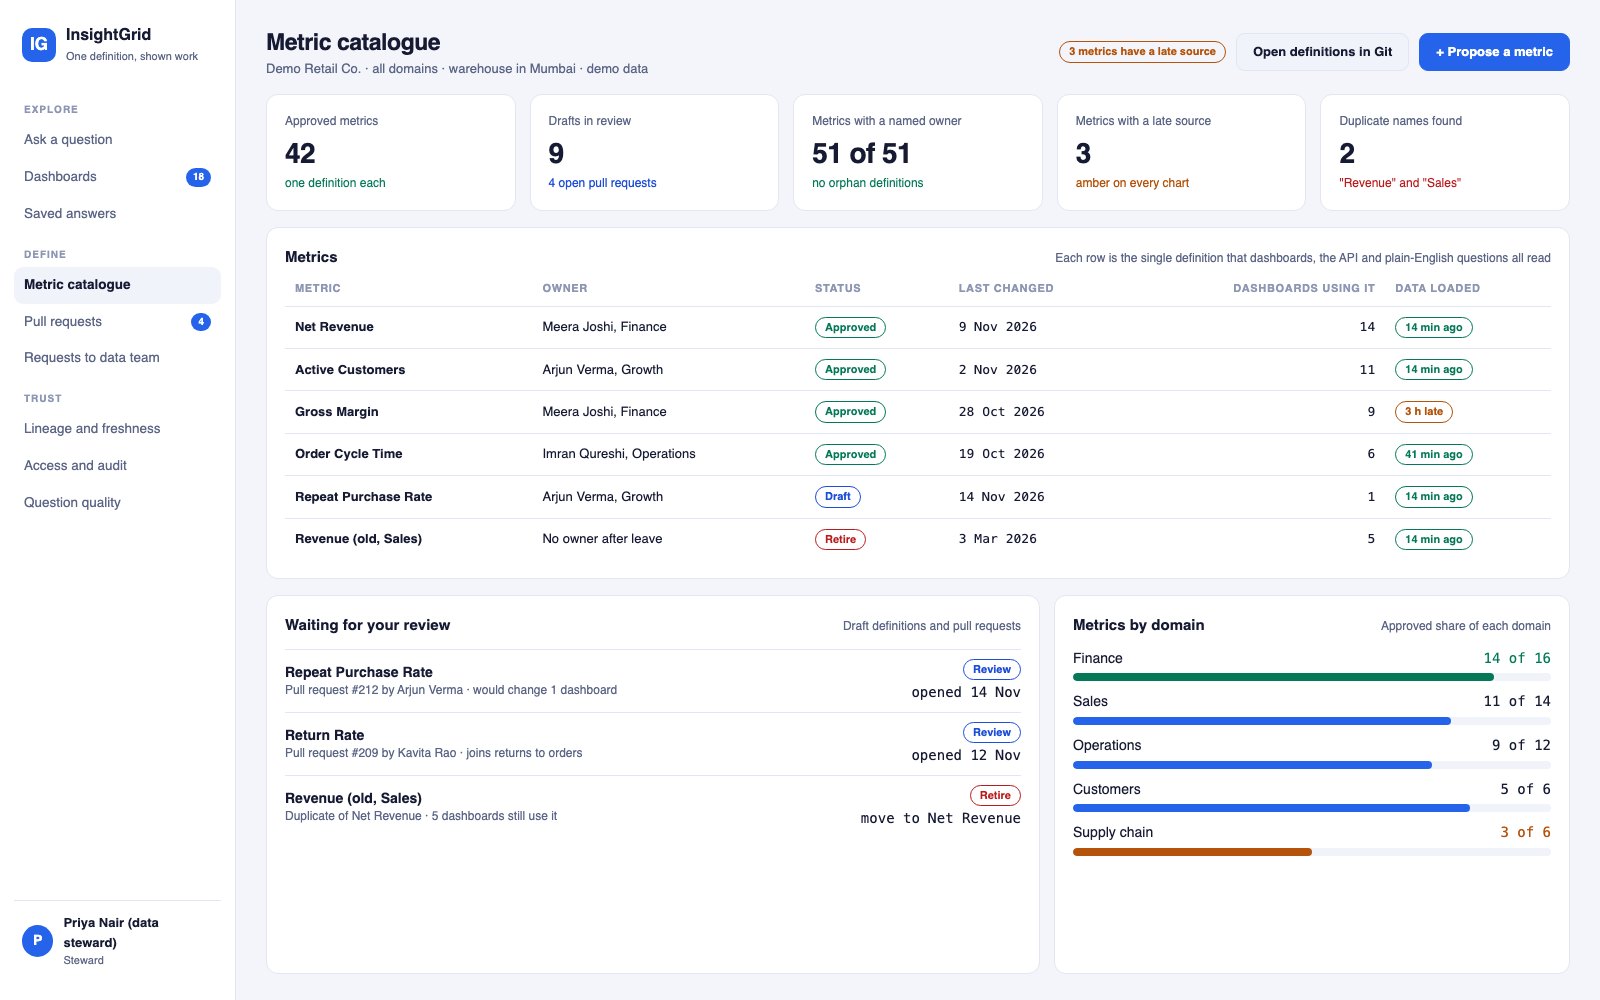
01 / 06 Metric catalogue - see each metric's single definition, its owner and status, and review drafts and duplicates
Engineering Process
- Map the company's real questions, current dashboards and the metrics people argue about with the data team and the managers who ask them.
- Model the semantic layer: metrics, dimensions, joins, owners and statuses, and write the first approved definitions with the finance and sales leads.
- Prototype the catalogue, question screen and dashboard builder and test them with managers on their own weekly questions.
- Build the query engine wiring, warehouse connector, sign-on and access rules first, then the catalogue, dashboards, SQL panel and freshness badges.
- Build the question feature with tool calling and a set of real questions with expected metric queries that runs in the build pipeline on every prompt or model change.
- Add lineage from pipeline events, Slack digests and embedded charts, then test caching and access scopes with people on different roles.
- Connect the live warehouse, check each approved metric against the numbers the company trusts today, train stewards and managers, and go live in stages.
Production Tech Stack
| Layer / Component | Production Technologies |
|---|---|
| Web app | Next.js 15TypeScriptTailwind CSSshadcn/uiApache EChartsCodeMirror 6 for the SQL panelReact Flow for lineage |
| Backend | Node.js with Fastify and TypeScript for the workspace APIPython FastAPI for language-model orchestration |
| Semantic layer | Metric definitions in YAMLcompiled by MetricFlow (Apache 2.0) or Cubewith a REST and GraphQL query endpoint |
| Database | Postgres for workspace dataRedis for cached results; customer data stays in the customer's own warehouse such as SnowflakeBigQuery or Postgres |
| AI | Anthropic Claude or OpenAI models with tool callingplus a test set of real questions run in CI |
| Cloud and tooling | Containers on AWS ECS Fargate or Google Cloud RunTerraformGitHub ActionsOpenLineage eventsSentry and OpenTelemetry |
What the design aims for
InsightGrid aims to anchor every number a company shows to one visible definition, so a reader can see how it was calculated, where its data came from and when it last loaded.